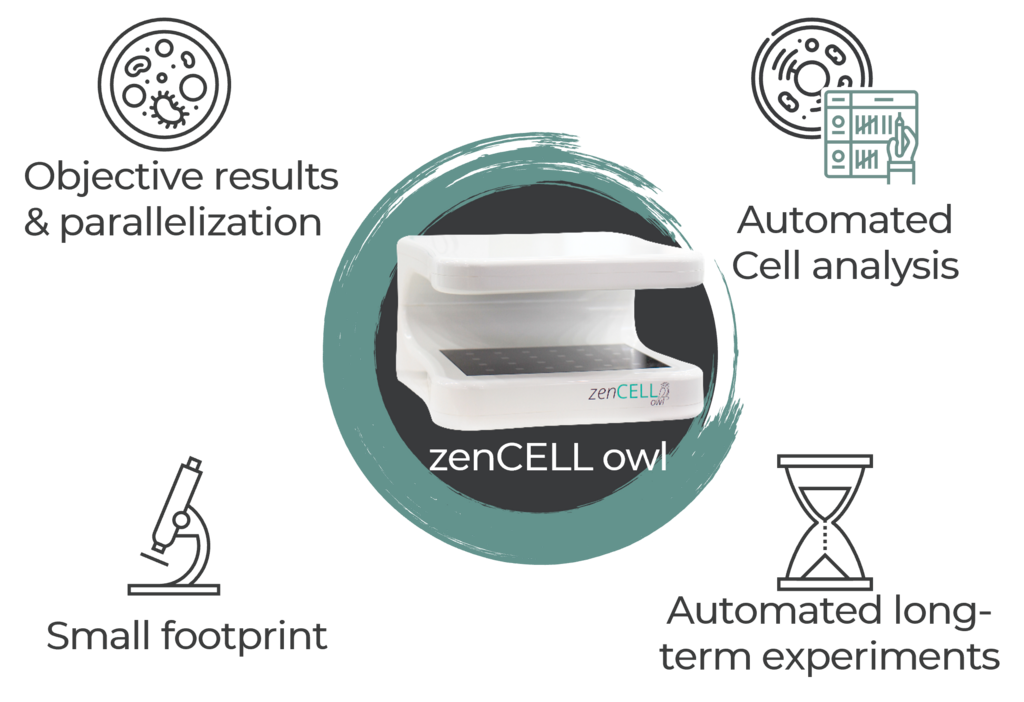
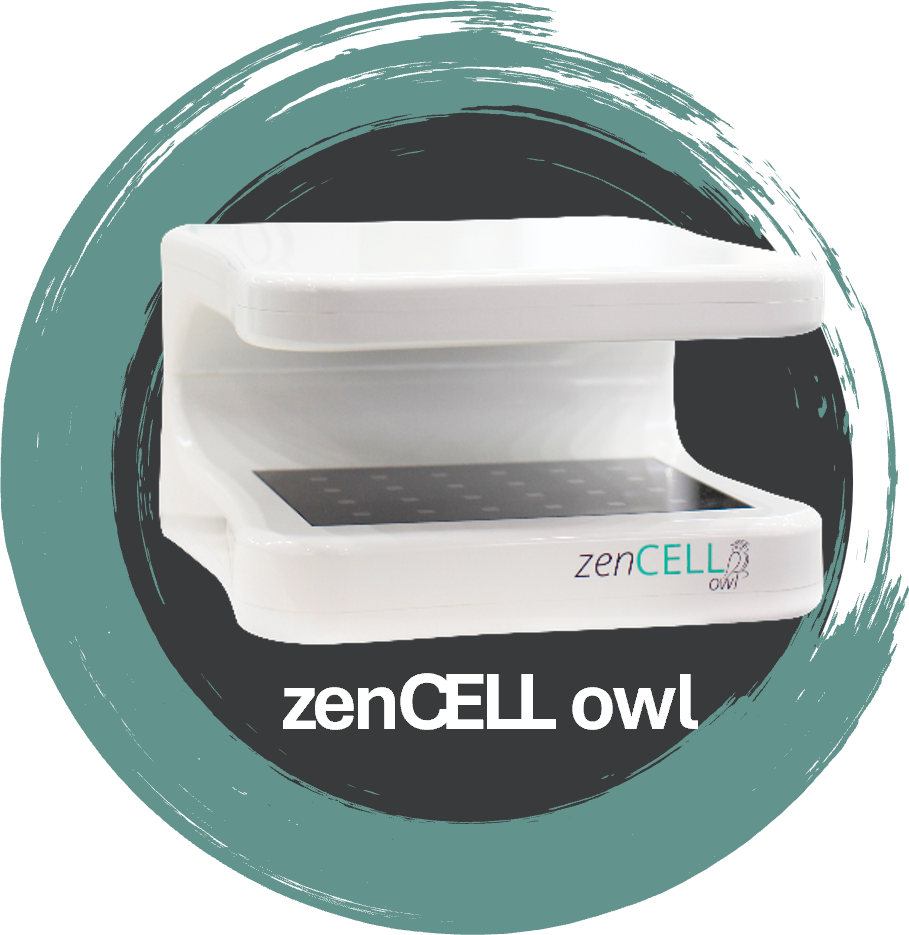
A groundbreaking 24-channel microscope for the incubator. Making your cell culture monitoring easier than ever. The compact and lightweight device ensures space-saving and uncomplicated use in the incubator. Data capturing, display and analysis is performed 24/7 in real time. Cell cultures can be comfortably monitored from your PC. The zenCELL owl is perfectly suited for routine and basic applications to save working time and create a greater amount of information about your cell cultures.
Microscopy for the incubator
Ever found yourself in monotonous but inevitable tasks surrounding your cell culture experiments?
Where every step needs to be planned meticulously –
from seeding, vacancy in the incubator, microscopy, adding compounds, keeping a stable environment for the cell, visiting the lab on late nights and weekends, detailed documentation and keeping objectivity all the time? – Does this sound familiar?

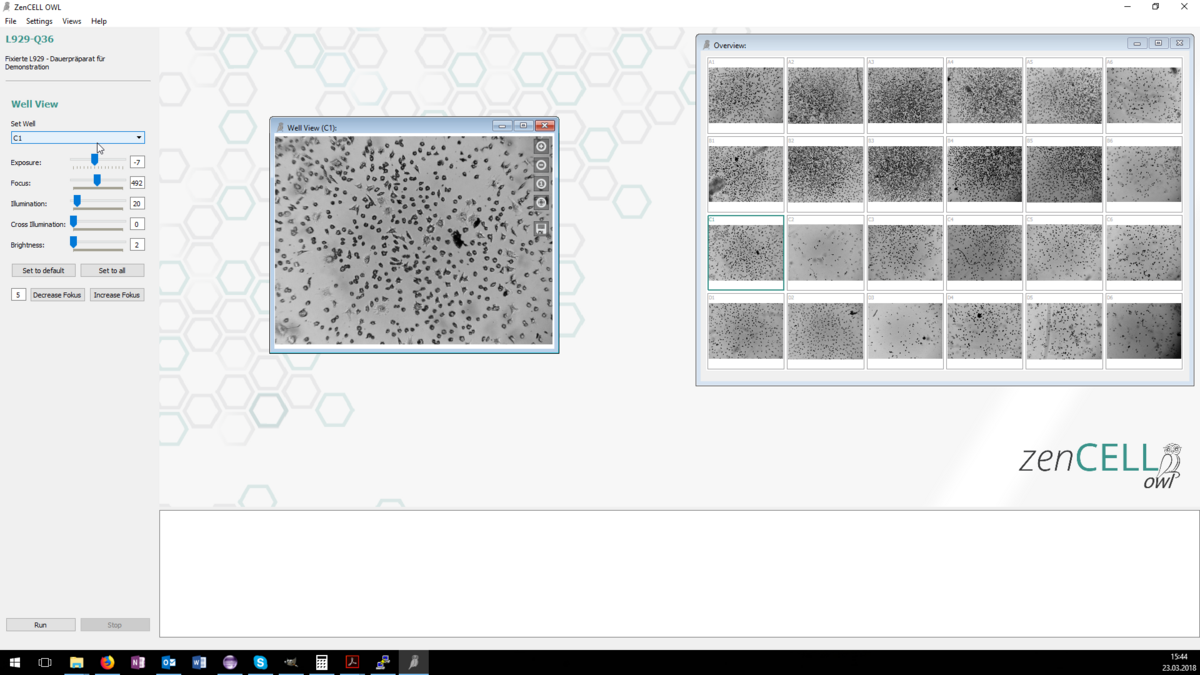
Set your intervals from a few minutes to 24h. Chose an endpoint for your experiment or manually stop it. Your images are taken automatically.

AI based smart algorithms calculate different statistics in the FOV and help you with your decision-making.

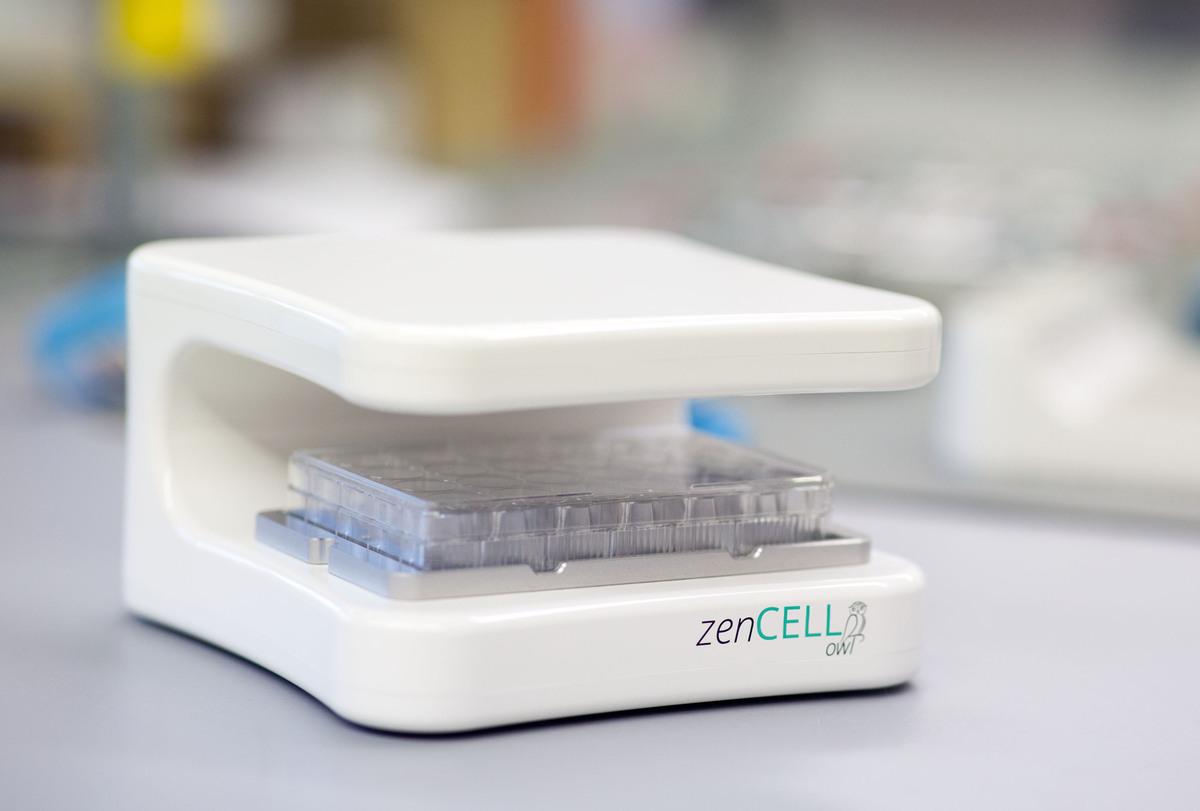
Only 1kg and half the size of a shoe box. Saves space inside and outside the incubator. Easy to be moved, stored and handled.

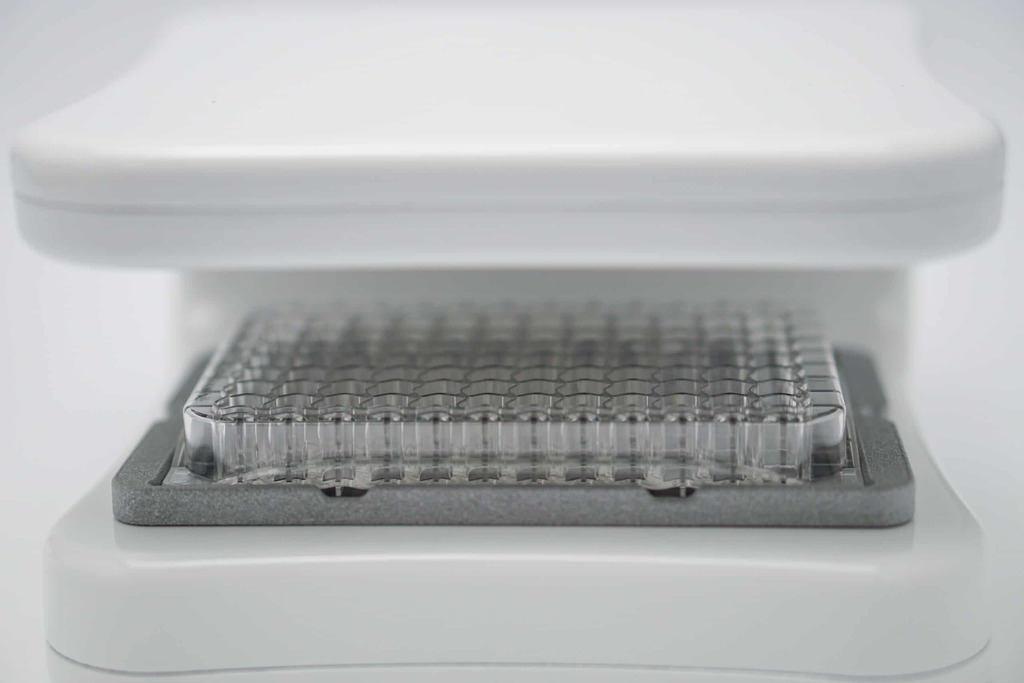
24 experiments at once. Create duplicates, triplicates, controls etc. to get statistically significant and objective results. Also perfect for testing compund and drug doses.
Record up to 24 cell cultures in parallel automatically around the clock and in long-term, if desired. Get a higher accuracy and more data with lower efforts.
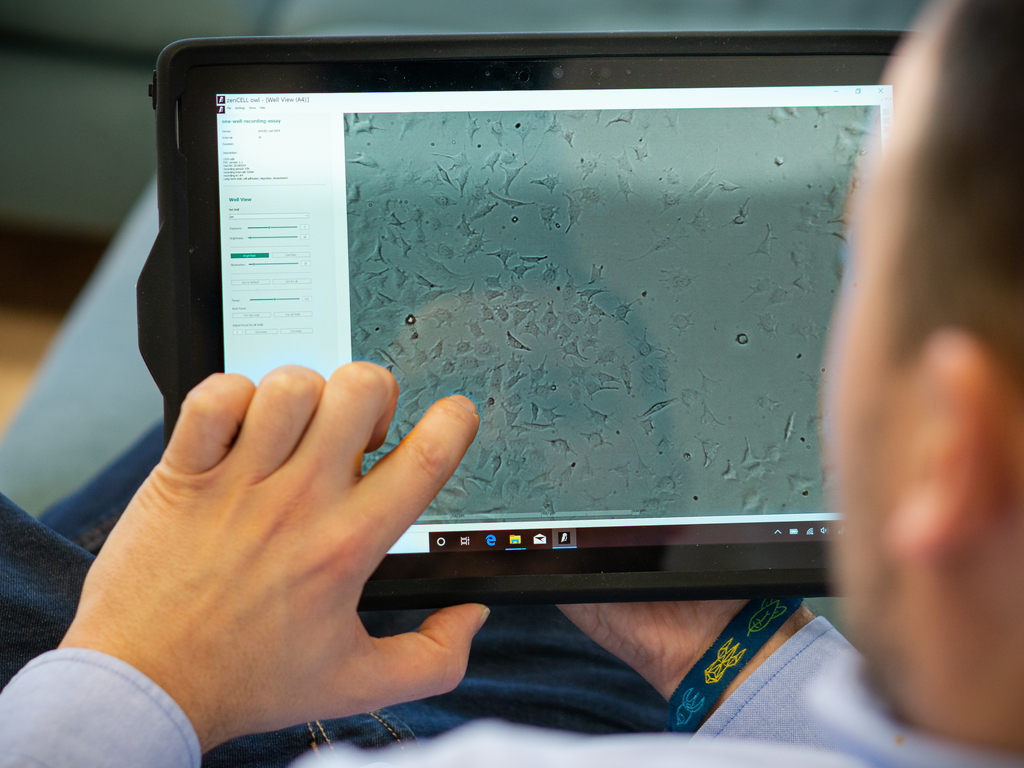
Repeated cell culture visits are time consuming and inefficient. Evaluate the current condition of your cell cultures online from outside the lab in your preferred frequency. React and intervene quickly, if necessary.
A consistent cell culture quality requires defined and stable conditions. zenCELL owl allows to keep cell cultures in the incubator preventing fluctuations of conditions (e.g. temperature, CO₂-supply and humidity) and lowering contamination risk. Defined culture conditions such as hypoxia can be applied!
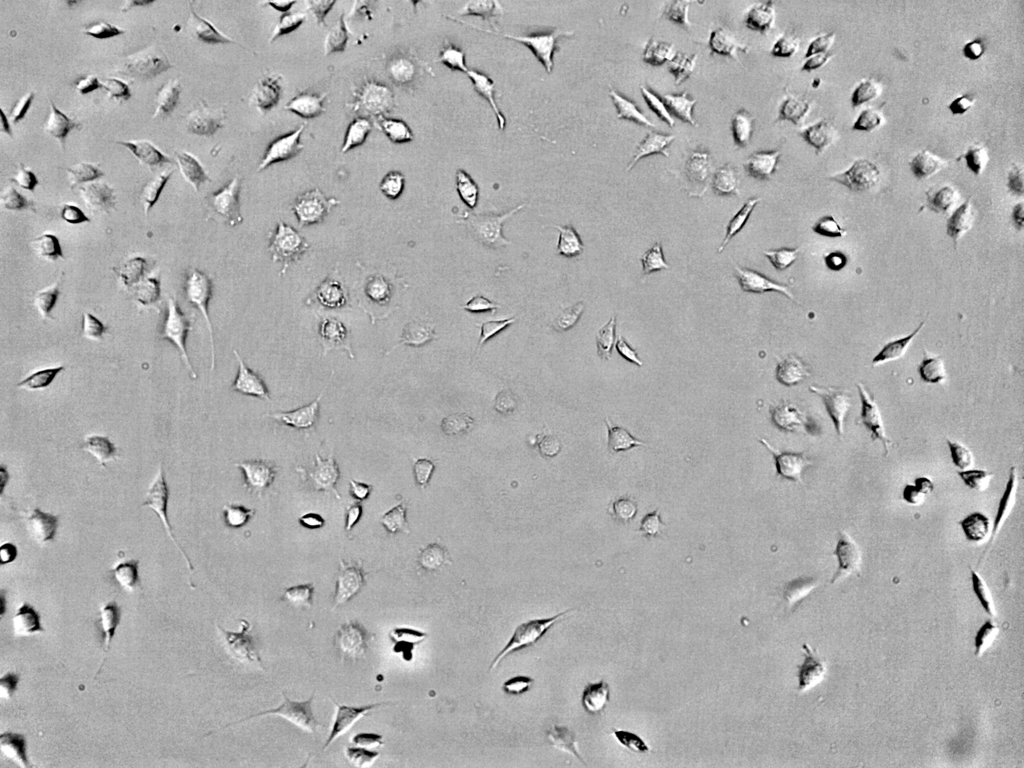
The perfect cell confluence is a critical factor for successful and reproducible cell experiments. Automatic calculation of cell confluence enables to get more objective and significant information about the confluence status. You can determine the perfect starting point for your experiments without subjective interpretation.
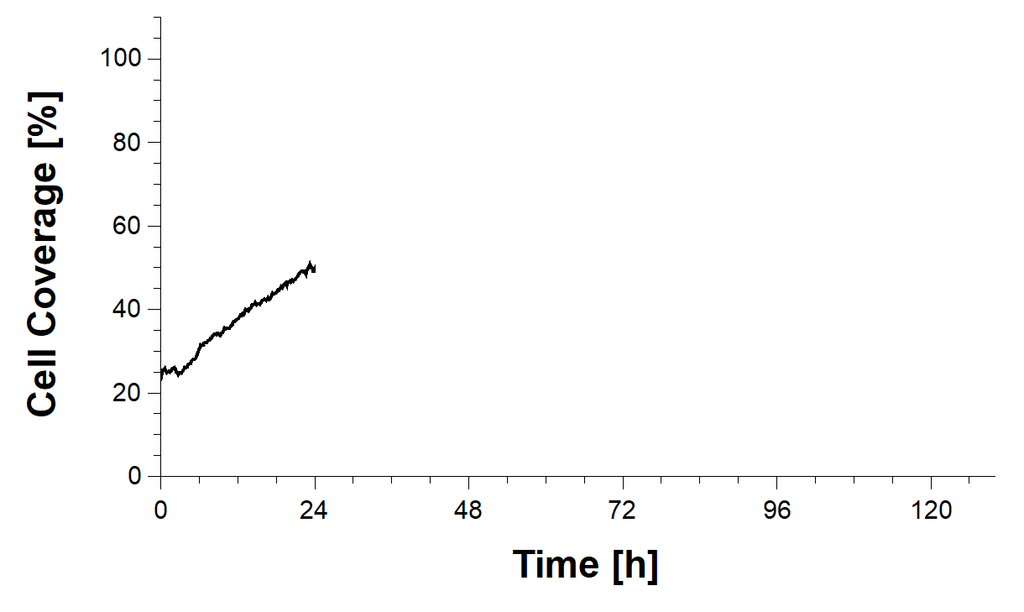
After 24 hours
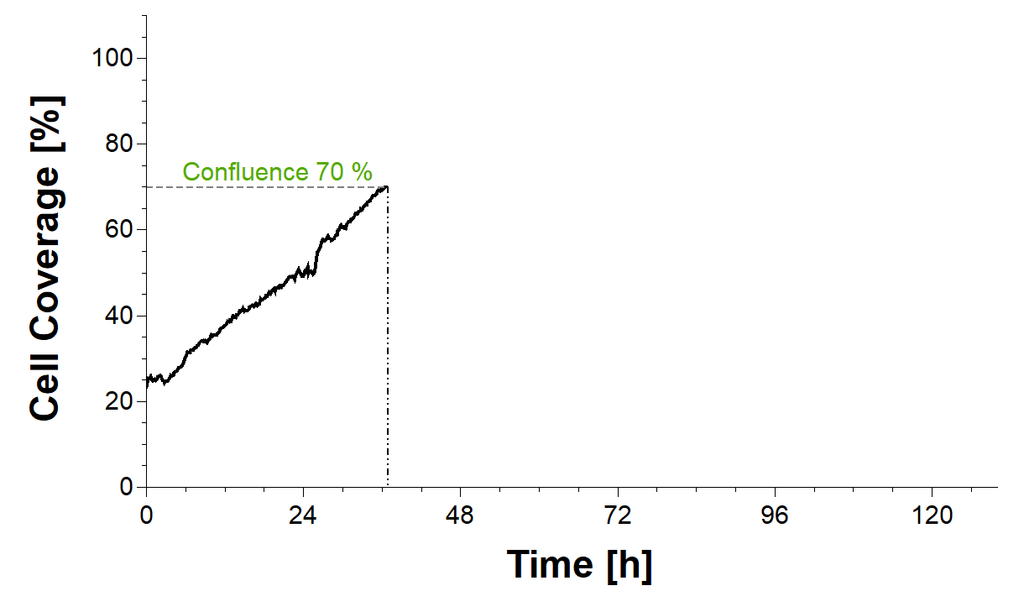
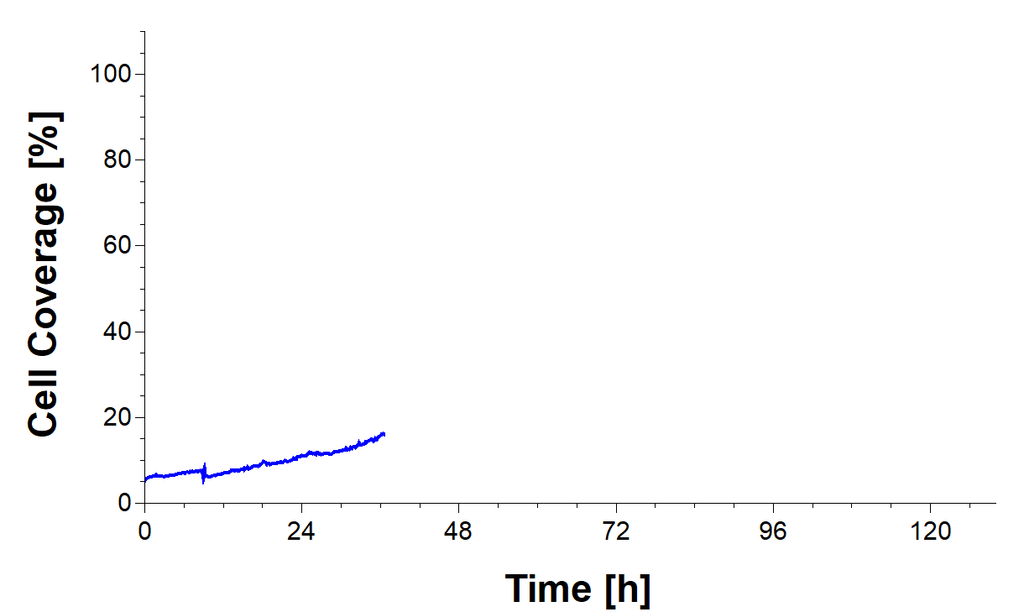
After 36 hours
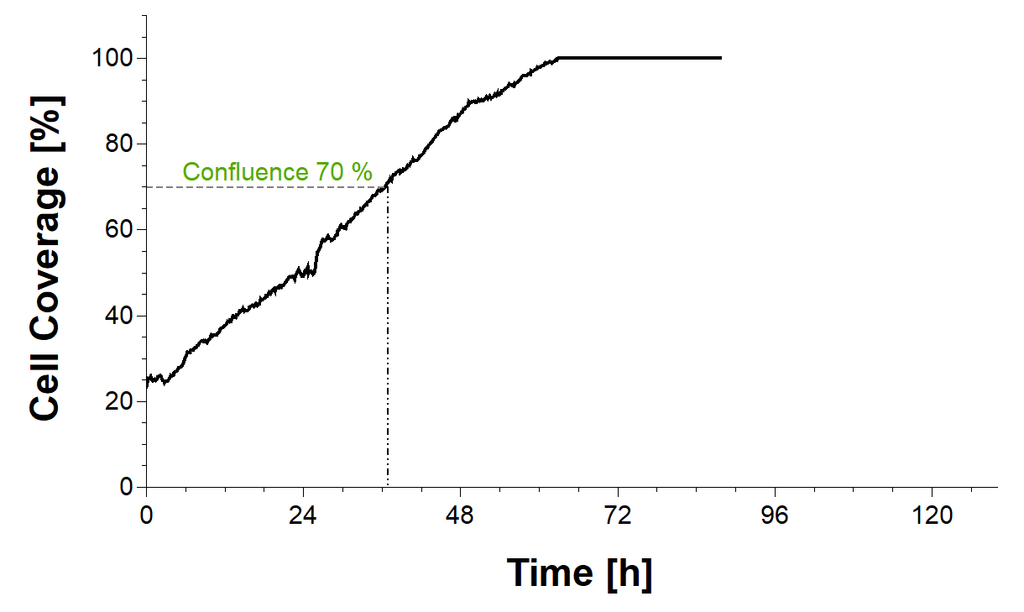
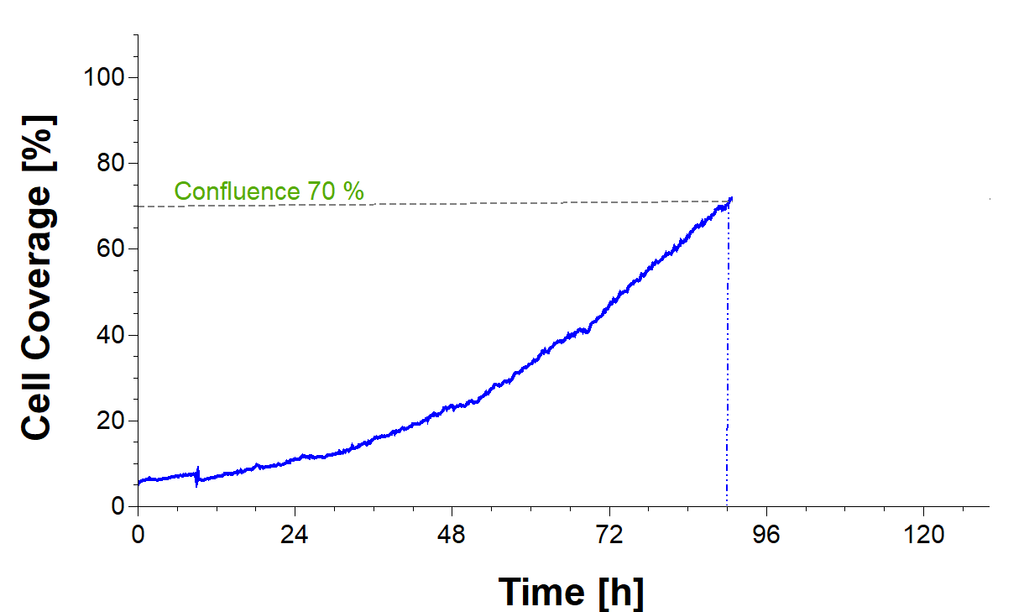
After 90 hours
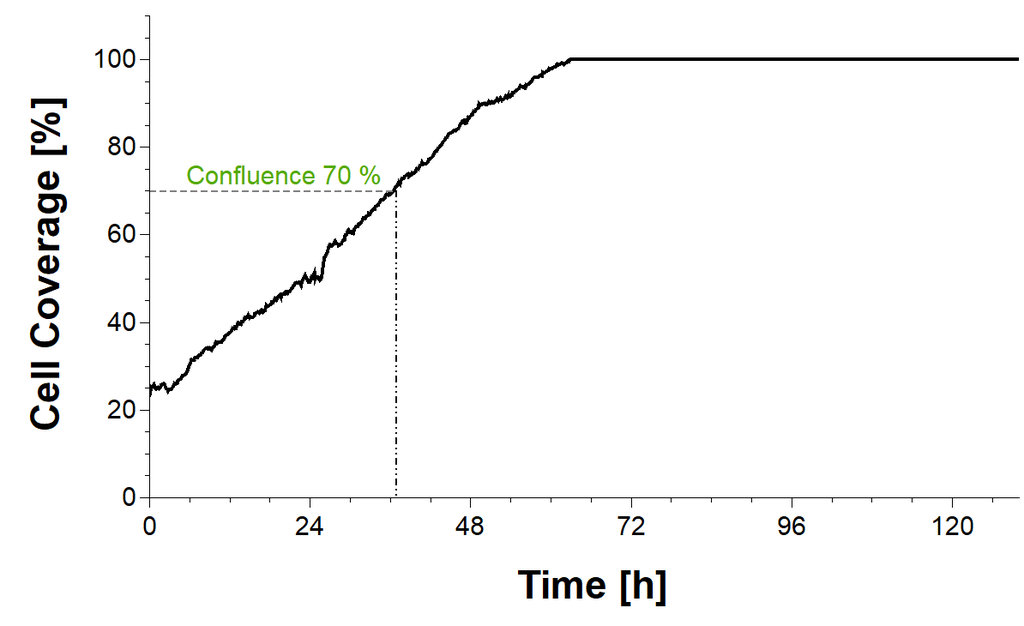
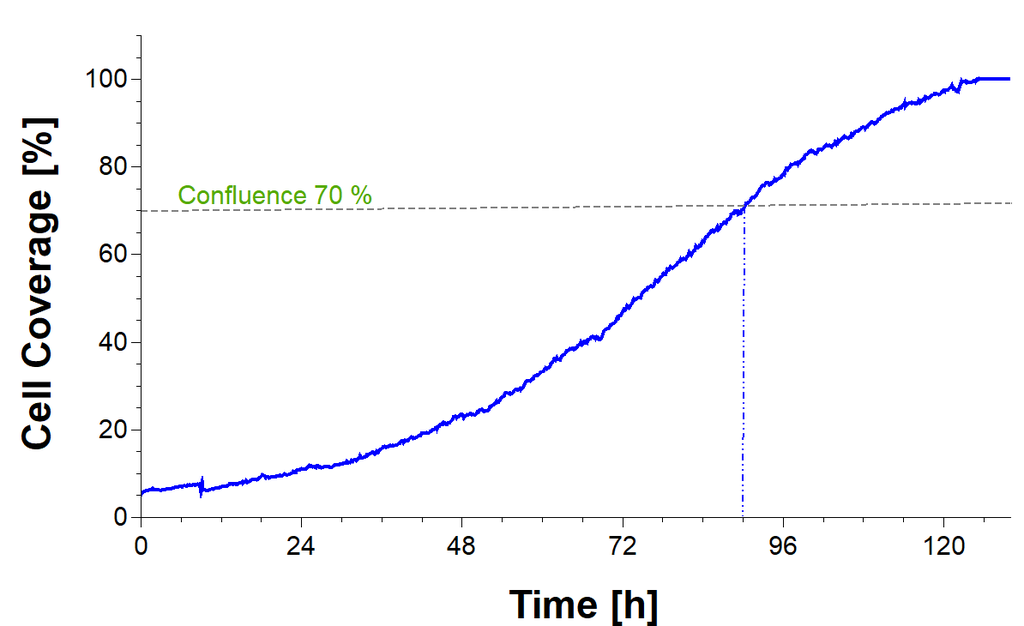
After 120 hours
Proliferation phase of cell culture.
Culture with higher cell count reaches confluence of 70 %.

Culture with higher cell count has already reached plateau phase.
Culture with higher cellCulture with higher cell count shows confluence of 100%. count has already reached plateau phase.
After 24 hours
After 36 hours
After 90 hours
After 120 hours
Proliferation phase of cell culture.
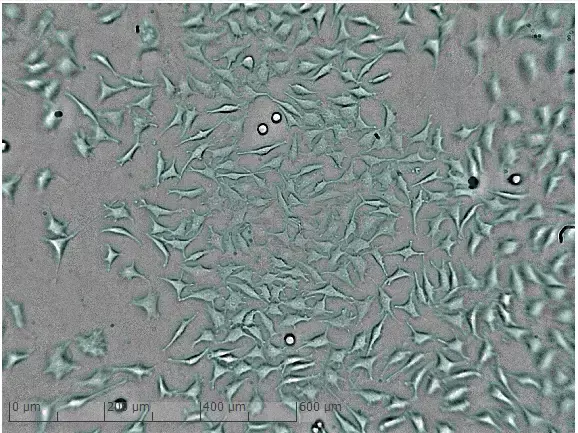
Culture with lower count shows confluence of 20%.
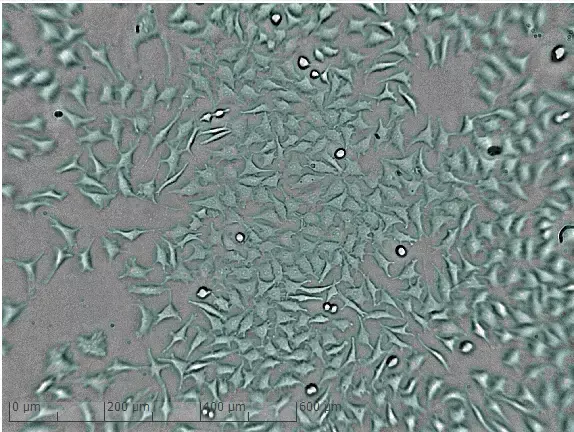
Culture with lower cell count reaches confluence of 70%.
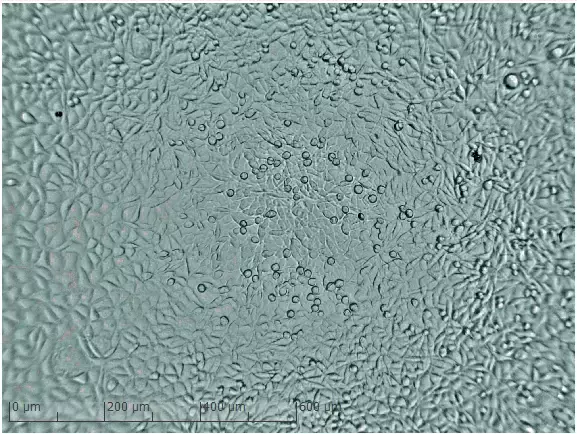
Culture with lower cell count reaches confluence of 100%.
A higher number of analyzed measurement points allow more precise conclusions about cell cultures.
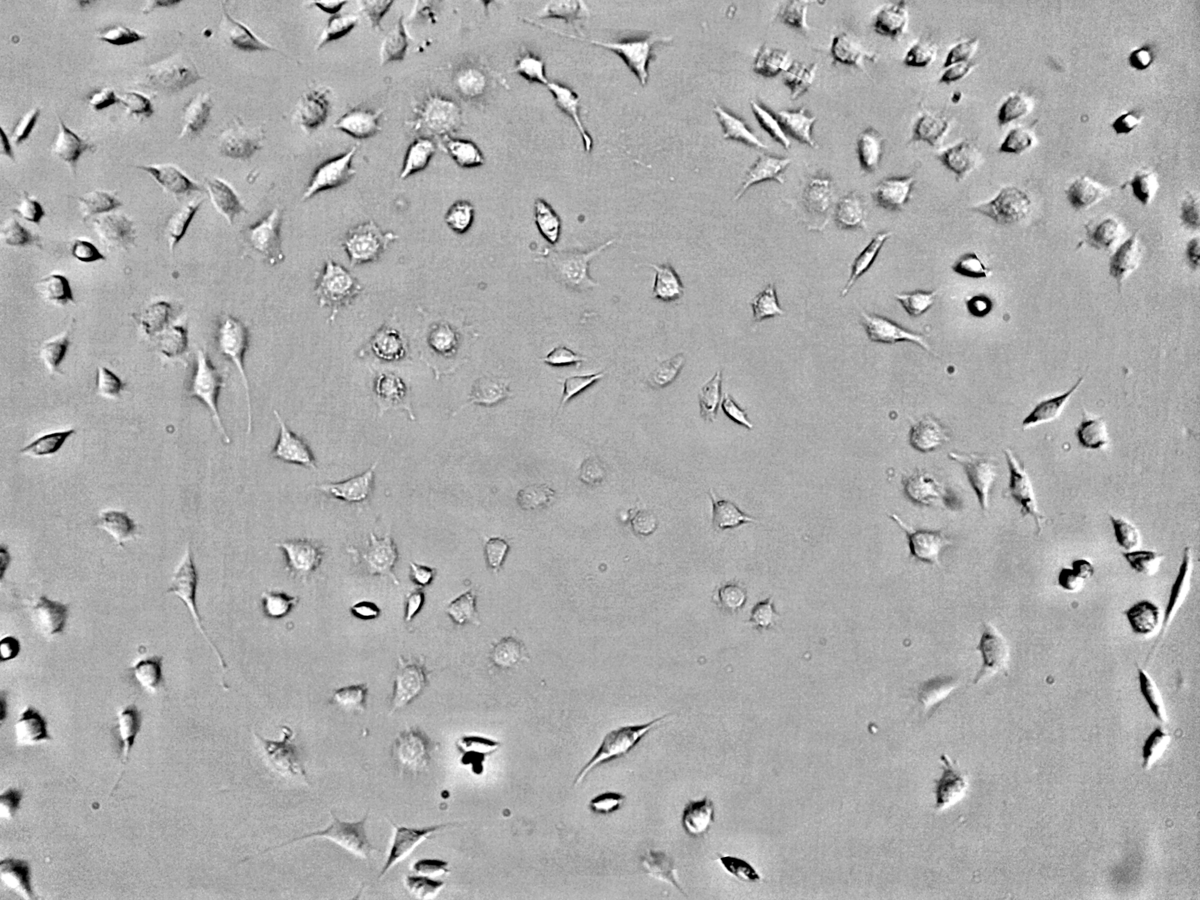
Analyze dynamic chances and developments of your cell culture retrospectively and in detail. Don´t miss any change in cell morphology by zooming down to single cell level and visualizing a cell while it’s dividing, moving or dying. Analyze the development of the confluence of cell cultures or number of colonies and compare different wells with each other. Use time lapse videos for your documentation.
Assays designed to measure cytotoxicity in vitro are used to predict tissue-specific toxicity or to identify leads for anti-cancer therapies. The cytotoxicity assay is widely used in the pharmaceutical industry and is a fundamental tool in the drug discovery process. Use the zenCELL owl incubator microscope for long term monitoring of dynamic changes in cell morphology as a result of drug treatment.
Evaluate the cytotoxic effect of different agents on up to 24 cell cultures simultaneously and in long-term. Automatic and around the clock data capturing enables to analyze every time-point of your cytotoxicity assay retrospectively and detailed. Observe changes in morphology and confluence online from outside the lab. zenCELL owl helps you to raise validity and reproducibility with lower efforts.
Create defined and stable environmental conditions and keep the cell cultures in the incubator. Analyze dynamic changes on single cell level and create time lapse videos for your documentation. Compare different drugs or different drug concentrations under identical environment conditions in an automated noninvasive way.
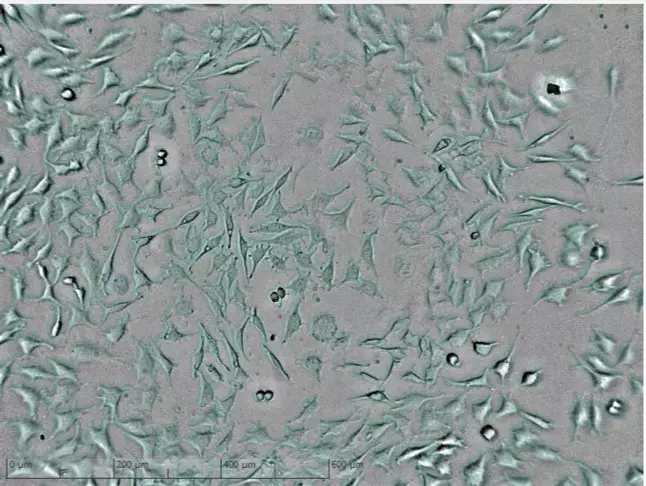
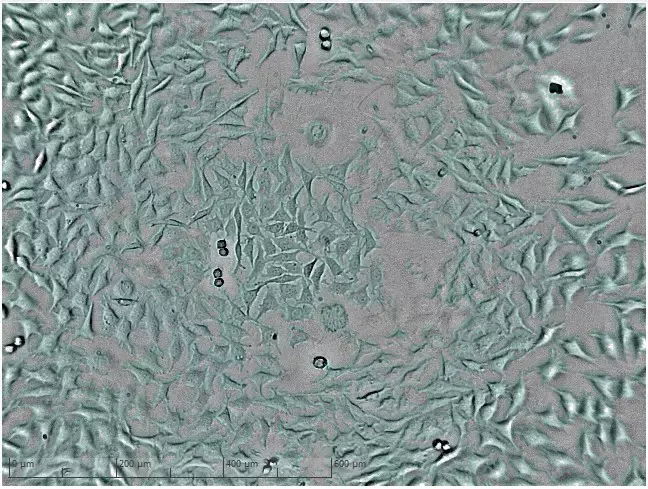
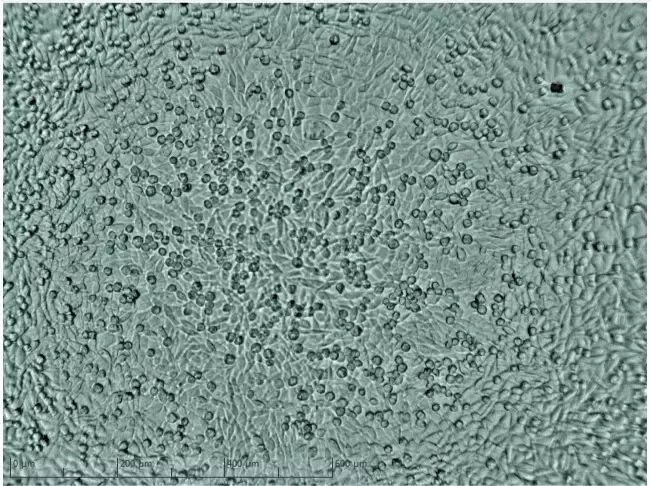
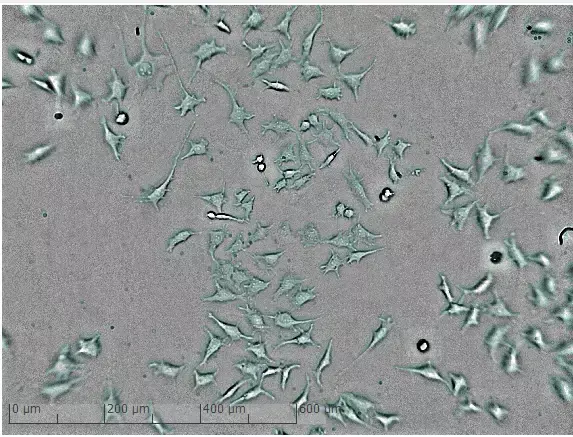
L929 mouse fibroblast cell cultures were treated with different concentrations of the cytostatic drugs Chloroacetaldehyde (CAA) and Doxorubicin (DOX). Drug treatment results in growth inhibition, loss of the original cell morphology and changes of intracellular granulation. Finally, drug treatment results in cell death. A time dependent dose-effect relationship can be observed for both cytostatic drugs.
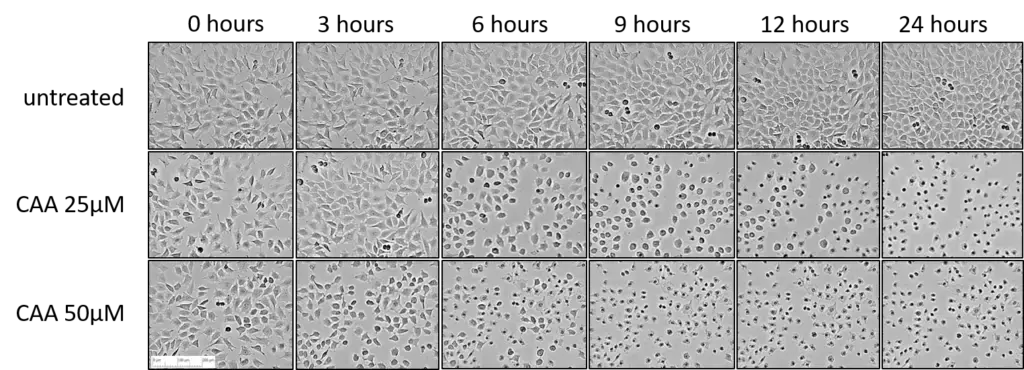
CAA treatment results in a dose-dependent growth inhibition, loss of cell morphology and cell death. Digital phase-contrast imaging of L929 cells. Scalebar: 200 µm
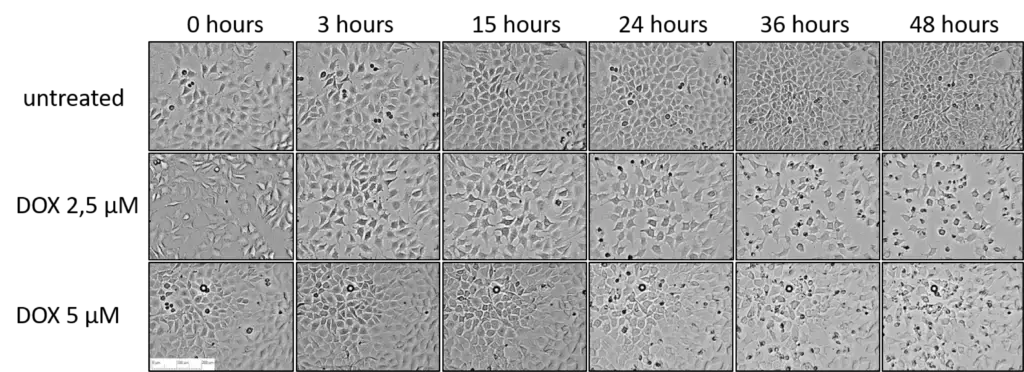
DOX treatment results in growth inhibition, loss of cell morphology and cell death. Digital phase-contrast imaging of L929 cells. Scalebar: 200 µm.
The wound healing, migration assay or scratch assay is a standard method to analyze cell migration in vitro. The dynamics of cell migration into a cell-free area, which has been created by direct manipulation or physical exclusion, are monitored and quantified to analyze cell migration characteristics and to calculate the gap closure time.
With conventional manual microscopy it is not possible to analyze each dynamic change which happens on cell levels at any time. zenCELL owl records pictures in an intervals of 5 minutes and every cell movement in detail – also during long-term analyses.
Observe and control every time-point and step of wound healing process retrospectively and in detail. Calculate the speed of wound healing by analyzing the increase of confluence in the gap area.
The simultaneous analysis of cell morphology and confluence in up to 24 wells under identical conditions optimizes the comparability of your results and reproducibility of data.
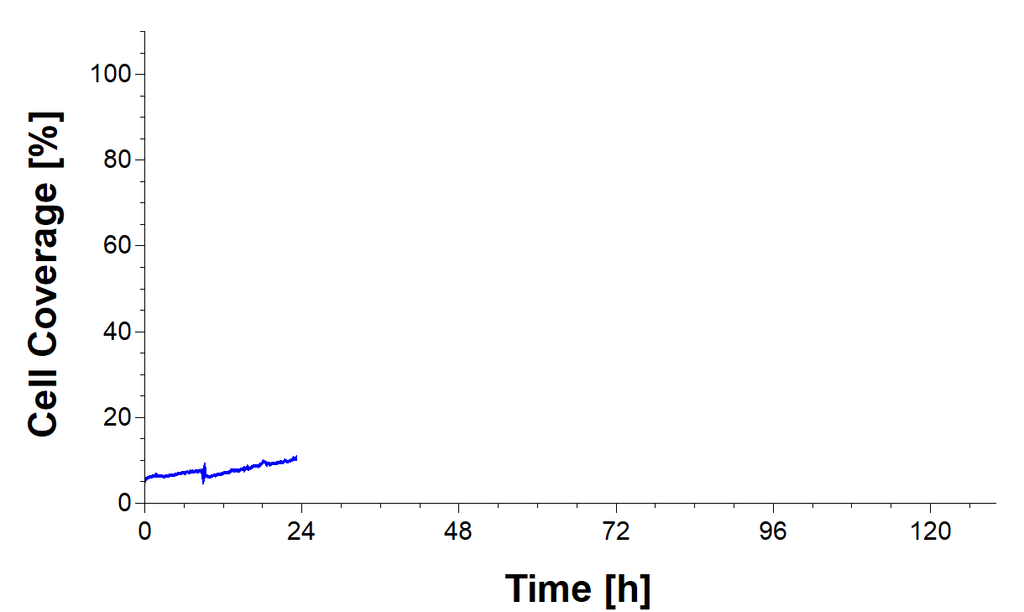
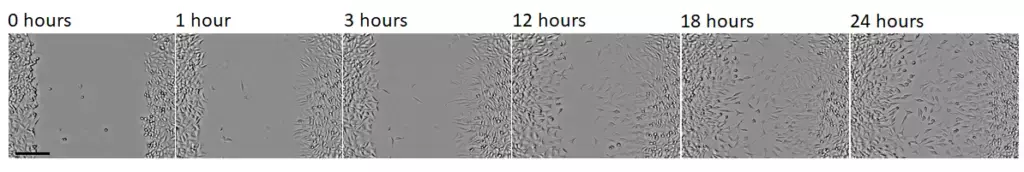
A migration assay of L929 fibroblasts were performed over a time period of 24 hours. The gap was inserted in a confluent monolayer by a pipet tip (0 hours). 1 hour after inserting the gap cells on the edge start to migrate. Within a time-period of 24 hours the cell migration results in a continuous closure of the gap.
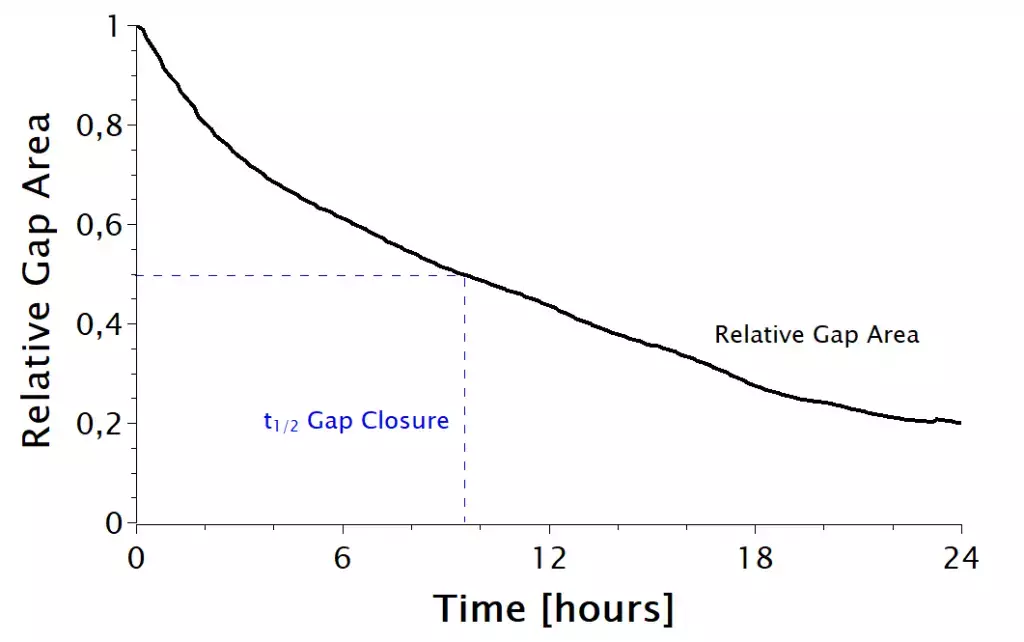
Data of Cell Coverage can be used to calculate the “Relative Gap Area” manually. Plotted as a function of time, the time-point of half gap closure (t1/2 Gap Closure) can be determined from this graph.
Do you have any questions?
Please contact us via direct message, email or phone.